Quick Answer
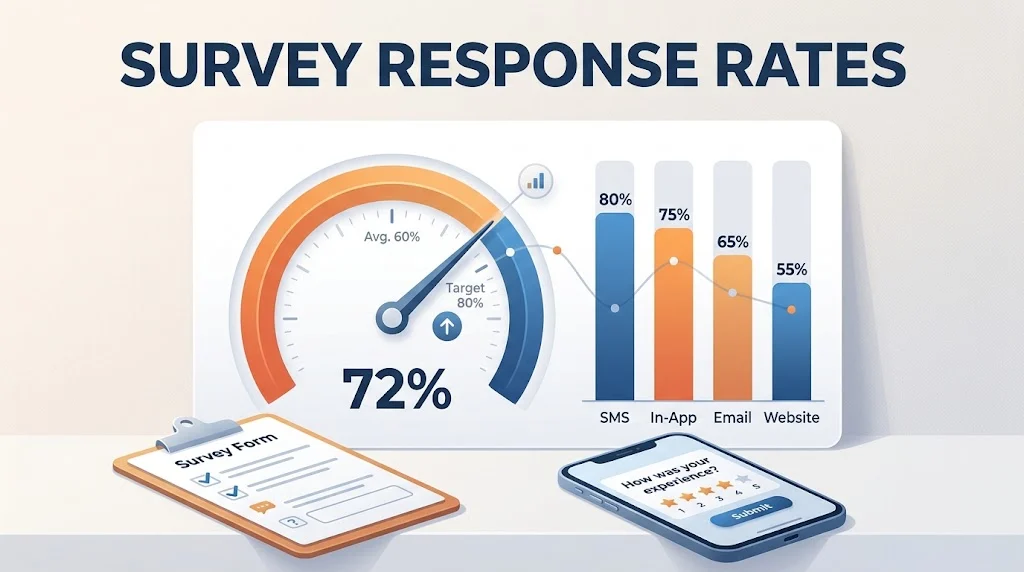
Survey response rate is the percentage of invited people who complete your survey. In 2026, the overall average is around 20% to 30%, but it varies widely by channel: SMS reaches 45% to 60%, in-app 20% to 30%, email 15% to 25%, and opt-in panels just 5% to 12%. A good rate is one that clears your channel benchmark and gives you enough responses for confidence.
You send a survey. A few responses come in. Then a trickle. Then nothing. You are left with a percentage and a nagging question: is this enough?
Survey response rates have been falling for years. Email surveys that once averaged 25% now sit closer to 15%. People are bombarded with feedback requests. The average consumer gets three to five per week. Each new survey competes with every other survey they have been asked to complete.
But the headline number hides enormous variation. The same survey sent three different ways can return wildly different results. A 20% response rate might be mediocre for a consumer brand and excellent for an enterprise software company surveying busy IT directors.
This article breaks down what survey response rates actually mean, how to calculate them correctly, what benchmarks to aim for by channel and industry, and how to improve participation without annoying your audience.
What Is a Survey Response Rate?
A survey response rate measures the percentage of people who completed your survey out of everyone who received it. If you send a survey to 500 customers and 75 complete it, your response rate is 15%.
Response rate evaluates the effectiveness of your invitation. It is not the same as completion rate. Completion rate measures the percentage of people who started a survey and made it to the end. A high response rate with a low completion rate suggests the survey itself is too long or confusing.
The basic formula is simple:
Response Rate = (Number of Completed Surveys ÷ Number of Invitations Sent) × 100
But the details matter. Bounced emails never reached the recipient and should not count in the denominator. Ineligible participants should be excluded. Partial completions may be counted separately.
Always define your terms before you calculate. Consistency matters more than the exact formula you choose.
How to Calculate Survey Response Rate
Calculating response rate is straightforward once you know what to count.
Step 1: Define your eligible sample. This is everyone who was eligible to take the survey. Exclude people who did not meet screening criteria.
Step 2: Subtract bounces and opt-outs. If an invitation email bounced, that person never received the survey. Remove them from the denominator.
Step 3: Count completed responses. A completed response is one where the participant finished the survey. Partial responses may be counted separately.
Step 4: Apply the formula.
Worked example:
- You invite 1,200 customers to take a survey
- 60 emails bounce. Delivered invitations: 1,140
- 285 customers complete the survey
- Response rate = (285 ÷ 1,140) × 100 = 25%
If 45 customers started but did not finish, you would report a completion rate of 25% and a partial response rate of 3.9%. Keeping them separate gives you a clearer picture.
2026 Survey Response Rate Benchmarks by Channel
Channel is the single biggest driver of response rate. The same survey sent three different ways can return wildly different numbers.
| Channel | Typical 2026 Response Rate |
|---|---|
| SMS / text | 45% to 60% |
| In-app / in-product | 20% to 30% |
| Embedded email (question in the email) | 15% to 25% |
| Linked email (click through to a page) | 6% to 15% |
| Opt-in panels | 5% to 12% |
| Website intercept / pop-up | 2% to 5% |
Two patterns stand out. First, embedded beats linked. Every extra click costs you respondents. Putting the first question directly in the email roughly doubles response versus a “click here to start” link.
Second, opt-in panels look convenient but underperform. The people who join panels for incentives are not always representative of your real customers.
Face-to-face surveys still produce the highest response rates, often 80% to 85%. But they are expensive and slow. Telephone surveys average 70% to 80%, though they have declined due to spam call filtering.
Survey Response Rates by Industry and Audience
Industry context matters as much as channel. A 20% response rate might be excellent in SaaS and mediocre in manufacturing.
B2B customer surveys: 20% to 30% is solid. B2B surveys land at a median near 21.88%, with some reports putting the average as low as 12.4%. Busy professionals, gatekept inboxes, and “survey from a vendor” skepticism all drag it down.
B2C customer surveys: 30% to 40% is common for warm, transactional audiences. B2C surveys reach a median around 36.67%. But B2C programs are declining faster than B2B.
Employee surveys: 70% to 90% is typical. Internal surveys consistently outperform external ones because the relationship is closer and the topic is more relevant.
SaaS customer surveys: 25% to 35% average. This varies by touchpoint and survey type.
Retail customer surveys: 10% to 20% average. Lower engagement and less personal connection drag down rates.
Financial services and telecom: Programs that once achieved 30% now struggle to reach 12%.
The spread between industries reflects inbox saturation, not copy quality. A SaaS founder gets dozens of survey requests per month. A manufacturing operations manager gets a handful.
What Counts as a Good Survey Response Rate?
There is no universal threshold. A good rate depends on your channel, audience, and the decision you need to make.
A good survey response rate is one that clears the benchmark for your channel and returns enough completed responses to hit your target sample size for statistical confidence.
As a quick rule of thumb:
- Below 10%: Low. Expect nonresponse bias. The people who answered may not represent the people who did not.
- 10% to 20%: Typical for cold email and external audiences.
- 20% to 30%: Solid. This is around the overall 2026 average.
- 30%+: Strong. Common for SMS, in-app, and engaged customer lists.
In B2B SaaS specifically, hitting 22% already puts you ahead of roughly three-quarters of your peers. “Good” is relative to your context, not an absolute number.
The Nonresponse Bias Problem
A high response rate does not guarantee valid results. A low response rate does not guarantee biased ones. What matters is whether non-respondents differ from respondents in ways that affect your findings.
Nonresponse bias occurs when the people who did not respond have different opinions, behaviors, or characteristics than those who did. In NPS surveys, promoters are more likely to respond than detractors. In satisfaction surveys, the happiest and angriest customers respond. The silent majority stays silent.
The math is stark. If your response rate is 25%, there is a 75% potential bias introduced by non-respondents. Standard statistical adjustments cannot fix this if the missing respondents differ systematically from those who replied.
A response rate drop from 24% to 14% means 1,000 fewer customers participated. If those missing respondents would have scored lower than the ones who responded, the actual score among the full customer base might have declined while the reported NPS improved.
Higher response rates reduce the risk of nonresponse bias. But they do not eliminate it. Always check who responded, not just how many.
Why Survey Response Rates Are Declining
Response rates have dropped from 20% to 25% in 2019 to 10% to 15% in 2025. The decline is structural, not cyclical.
Three forces drive the drop.
Survey fatigue. The average consumer receives three to five feedback requests per week. Post-purchase surveys, CSAT surveys, NPS surveys, app store prompts, delivery ratings. Each one takes only a minute, but the cumulative demand on attention is substantial. Customers develop an automatic dismissal reflex that applies across all brands.
No perceived payoff. Customers who filled out a survey before and saw nothing change assume this one goes into the same void. The rational move is to skip it. Closing the loop on feedback is one of the most effective ways to encourage future participation, yet many organizations never do it.
Timing mismatch. A relationship survey sent on a calendar cadence rarely coincides with a moment the customer actually has an opinion. If nothing notable happened this month, there is no reason to reply.
Qualtrics reported that average response rates across their platform declined 27% between 2020 and 2024. Medallia observed similar patterns. The American Customer Satisfaction Index has noted increasing difficulty maintaining representative samples.
How to Improve Survey Response Rates
Improving response rates is not about tricks. It is about respecting the respondent’s time, attention, and context.
Keep it short. Survey length is the most consistent predictor of abandonment. Nearly half of all respondents (48%) are willing to spend only 1 to 5 minutes completing a feedback survey. Aim for under 10 questions. For pulse surveys, 5 questions or fewer is often enough. Response rate typically falls 1 to 2 percentage points per additional question over a 10-question baseline.
Embed the first question in the email. Every extra click costs you respondents. Putting the first question directly in the email roughly doubles response versus a “click here to start” link.
Personalize the invitation. Use the recipient’s name. Reference something specific to them. A founder or CEO send lifts results 15% to 25% above a generic no-reply address.
Send at the right time. Tuesday through Thursday, mid-morning, works best for most B2B audiences. Transactional surveys should be sent within 24 to 48 hours of the interaction. A customer who received support three weeks ago is less likely to recall the experience clearly.
Use incentives thoughtfully. Prepaid cash incentives, even as little as $1, can meaningfully improve response rates. They work by building goodwill and a sense of obligation. Pre-incentives are even more effective when the money is visible through a clear window in the mailing envelope.
Follow up once or twice. A single reminder can significantly boost response rates. More than three reminders risks annoyance.
Trigger surveys off events, not dates. Event-based timing feels more relevant. A post-support survey after a ticket is resolved will outperform a quarterly relationship survey sent on a calendar cadence.
Close the loop. Let respondents know their feedback was heard. Customers who see no change after giving feedback stop giving feedback.
Optimize for mobile. A large share of surveys are opened on phones. If your survey is not mobile-friendly, you lose respondents before they start.
Survey Response Rate vs Completion Rate
These two metrics are often confused. They measure different things and tell different stories.
Response rate measures the percentage of invited people who started your survey. It evaluates the effectiveness of your invitation.
Completion rate measures the percentage of people who started a survey and made it to the end. It evaluates the effectiveness of the survey itself.
A high response rate with a low completion rate signals that your invitation worked but your survey design failed. People started, then dropped off. The fix is to shorten the survey or remove confusing questions.
A low response rate with a high completion rate signals that your invitation failed but your survey design is fine. People who started finished. The fix is to improve targeting, timing, or the invitation itself.
Track both metrics together. They tell a more complete story than either one alone.
How to Calculate Your Required Sample Size
Before you can judge whether your response rate is good enough, you need to know how many responses you actually need.
The required sample size depends on your population, your desired confidence level, and your margin of error. For a large population and a 95% confidence level, here is a practical guide:
| Population Size | Required Sample Size (95% confidence, ±5% margin) |
|---|---|
| 100 | 80 |
| 200 | 132 |
| 400 | 196 |
| 600 | 234 |
| 800 | 260 |
| 1,000 | 278 |
| 2,000 | 322 |
| 5,000 | 357 |
| 10,000 | 370 |
| 100,000+ | 384 |
The required sample plateaus around 384 for large populations. This is why national polls often survey around 1,000 people.
Once you know your required sample, you can calculate the response rate you need:
Required Response Rate = (Required Sample Size ÷ Population Size) × 100
If you need 278 respondents from a population of 1,000, your required response rate is 27.8%.
But this assumes you can reach everyone. In practice, you should adjust for expected nonresponse. If you expect a 30% response rate and need 278 respondents, you need to invite 927 people.
Common Mistakes When Working With Survey Response Rates
Even experienced researchers make these mistakes. Avoiding them keeps your data accurate.
Chasing a universal threshold. There is no magic number. The right rate depends on your study, your population, and your channel.
Ignoring nonresponse bias. A high response rate from a skewed sample is not valid. Check who responded, not just how many.
Confusing response rate with completion rate. They measure different things. Track both.
Using sent invitations instead of delivered invitations. Bounced emails never reached the recipient. Subtract them from the denominator.
Counting partial responses as complete. A partial response is not the same as a completed one. Report them separately or exclude them.
Over-surveying the same audience. Survey fatigue is cumulative. Limit requests and rotate recipients.
Not planning for nonresponse. If you need 300 respondents and expect a 20% response rate, you need to invite 1,500 people. Plan ahead.
Treating all channels the same. An SMS response rate and an email response rate are not directly comparable. The benchmarks differ.
FAQs
What is a good survey response rate in 2026?
A good rate depends on your channel and audience. For SMS, 45% to 60% is typical and for in-app surveys, 20% to 30%. for email, 15% to 25%. For cold outreach, anything above 5% is doing well. In B2B SaaS, 22% puts you ahead of roughly three-quarters of your peers.
How do I calculate survey response rate?
Divide the number of completed surveys by the number of delivered invitations. Multiply by 100. Exclude bounces and ineligible participants from the denominator. Report completion rate separately.
Is a 30% response rate statistically valid?
It depends on your population and your required sample size. A 30% response rate from a population of 500 gives you 150 respondents. That is a margin of error of about ±8% at 95% confidence. That may be acceptable for some studies and not others.
Why is my survey response rate so low?
Low response rates usually come from survey fatigue, poor timing, or a lack of perceived payoff. The average consumer receives three to five feedback requests per week. If your survey arrives at a random moment with no clear reason to reply, it gets ignored.
What is the difference between response rate and completion rate?
Response rate measures the percentage of invited people who started your survey. Completion rate measures the percentage of people who started and made it to the end. A high response rate with a low completion rate suggests the survey is too long or confusing.
Does offering incentives improve survey response rates?
Yes. Prepaid cash incentives, even as little as $1, can meaningfully improve response rates. They work by building goodwill and a sense of obligation. Pre-incentives are more effective than promised incentives.
How many follow-ups should I send?
One or two reminders, spaced three to seven days apart. More than three risks annoying respondents and damaging your sender reputation.
What is nonresponse bias?
Nonresponse bias occurs when the people who did not respond differ from respondents in ways that affect your results. In NPS surveys, promoters respond more than detractors. In satisfaction surveys, the happiest and angriest customers respond. Higher response rates reduce the risk of nonresponse bias but do not eliminate it.
Conclusion
Survey response rates are not just a number. They are a measure of whether your feedback program represents your audience. A high rate from a skewed sample is worse than a lower rate from a balanced one. Focus on the right channel, keep it short, time it well, and close the loop. When you do, your response rate becomes a signal you can trust.
Read More Related Articles :
- 350+ Cold Emails That Get Responses | Proven Templates, Tips & Examples In 2026
- 350+ How to Calculate Response Rate | Formula, Examples & Easy Guide In 2026
- 350+ Cold Email Response Rate | Benchmarks, Averages & Ways to Improve In 2026

James Wilson is a passionate blogger and writer at RespondLabs.com, sharing fresh perspectives on technology, business and everyday digital trends. His writing combines clear insights with an engaging, reader-friendly style.