Quick Answer
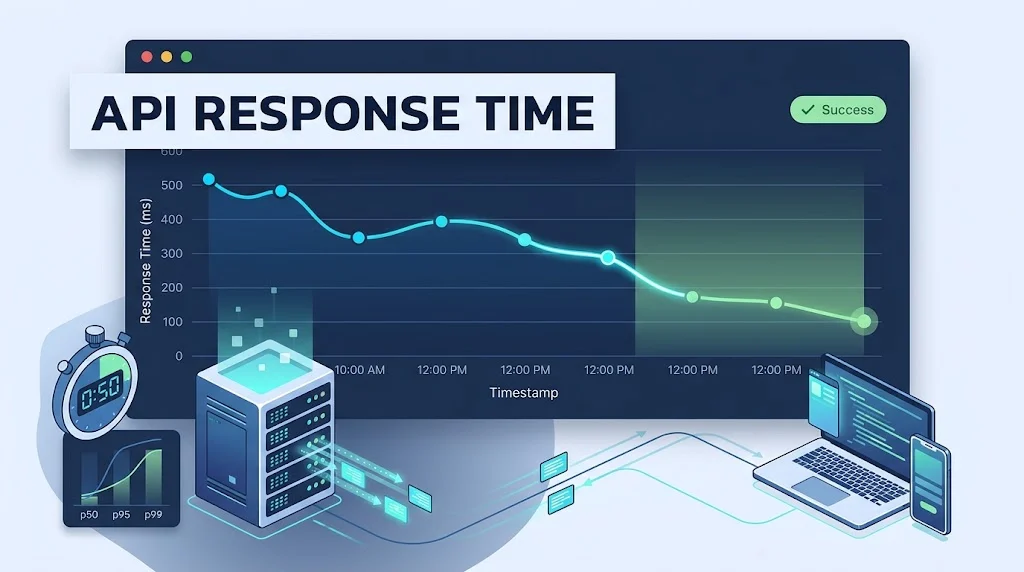
API response time is the total time between sending a request and receiving the full response. This includes network latency, server processing, database queries, and data transfer. A good target for most web APIs is under 200ms for the server-side portion.
Every time you open an app, load a webpage, or send a payment, an API call happens behind the scenes. The speed of that call shapes how the experience feels. A slow API makes a fast app feel broken. A fast API makes even simple interactions feel instant.
API response time is one of the most important metrics in software performance. It affects user satisfaction, conversion rates, search rankings, and infrastructure costs. Yet it is often misunderstood. Teams measure it inconsistently, blame the wrong layer, or optimize the wrong thing.
This article explains what API response time actually measures, how it differs from latency, what benchmarks to aim for, and how to diagnose and improve slow endpoints. Whether you are a developer, a product manager, or a technical founder, this guide gives you a clear framework for making your APIs faster.
What Is API Response Time?
API response time is the total time it takes for a client to send a request and receive a complete response from a server. It is measured in milliseconds (ms).
The clock starts when the client sends the first byte of the request. It stops when the client receives the last byte of the response. Everything in between counts toward the total.
That window includes several distinct phases:
- DNS lookup: Resolving the API hostname to an IP address
- TCP handshake: Establishing the connection
- TLS handshake: Negotiating encryption (for HTTPS)
- Request transmission: Sending the request over the network
- Server processing: Running the application logic
- Database queries: Fetching or writing data
- Response generation: Serializing the response body
- Response transmission: Sending the data back to the client
Each phase adds time. A slow response could be caused by any one of them. This is why measuring the total without breaking it down is rarely enough.
API Response Time vs Latency
Response time and latency are often used interchangeably, but they are not the same.
Latency is the time it takes for a single packet to travel from one point to another. It is a measure of network delay. Response time is the total time from request to completed response. It includes latency plus processing time on the server.
Here is a simple way to think about it. Latency is the travel time. Response time is the travel time plus the time spent at the destination.
A request can have low latency but high response time if the server is slow. It can also have high latency but reasonable response time if the server is fast and the payload is small. Both metrics matter, but they measure different things.
For most performance work, response time is the metric users actually feel. Latency is one of its inputs.
What Counts as a Good API Response Time?
There is no universal threshold. A good response time depends on the type of API, the use case, and user expectations.
That said, here are commonly cited benchmarks:
| Response Time | What It Feels Like |
|---|---|
| Under 100ms | Instant. No perceived delay. |
| 100ms to 200ms | Fast. Users do not notice. |
| 200ms to 500ms | Acceptable. Slight delay but fine for most interactions. |
| 500ms to 1 second | Noticeable. Users may feel a pause. |
| 1 to 3 seconds | Slow. Users may lose focus. |
| Over 3 seconds | Frustrating. Many users abandon the action. |
For customer-facing web APIs, a common target is under 200ms for the server-side processing time. For internal APIs or batch operations, higher values may be acceptable.
Google has found that anything above 200ms noticeably affects user experience. Amazon reported that every 100ms of added latency cost 1% in sales. These numbers are widely cited but should be treated as directional, not universal.
Different API types have different targets:
- Authentication APIs: Under 100ms
- Read-heavy APIs (GET): Under 200ms
- Write APIs (POST, PUT): Under 500ms
- Search APIs: Under 500ms
- Report or analytics APIs: Under 2 seconds
- Batch or async operations: Return quickly with a job ID, process in background
The right target depends on what the user is doing and how often they do it.
Server-Side vs Client-Side Response Time
Response time can be measured from two vantage points. Each tells a different story.
Server-side response time is the time the server spends handling the request. It starts when the server receives the request and ends when it sends the response. This is what your application code controls.
Client-side response time is the total time the user experiences. It includes server-side time plus all network overhead, DNS resolution, and connection setup.
If server-side time is 50ms but client-side time is 800ms, the problem is in the network or connection layer, not the application. If server-side time is 700ms and client-side is 750ms, the application is the bottleneck.
Measuring both helps you isolate where the time is actually going.
How to Measure API Response Time
Measurement is the first step toward improvement. You cannot optimize what you do not measure.
Application Performance Monitoring (APM) tools. Tools like Datadog, New Relic, and Dynatrace instrument your code and measure response time automatically. They break down time by function, database query, and external call.
Server logs. Most web servers and frameworks log response time per request. Parsing these logs gives you a baseline and helps identify slow endpoints.
Synthetic monitoring. Tools like Pingdom, UptimeRobot, and Checkly send requests from multiple locations at regular intervals. They measure response time from the user’s perspective.
Real User Monitoring (RUM). RUM tools collect timing data from actual users. They show how response time varies by device, location, and network.
Distributed tracing. Tracing tools like Jaeger and OpenTelemetry follow a single request across multiple services. They show exactly where time is spent in a microservices architecture.
Load testing. Tools like k6, JMeter, and Locust simulate concurrent users and measure how response time changes under load.
For a complete picture, combine several methods. APM for code-level detail. Synthetic monitoring for baseline uptime and speed. RUM for real-world experience. Load testing for capacity planning.
Common Causes of Slow API Response Time
Slow APIs rarely have a single cause. Here are the most common culprits.
Unoptimized database queries. Missing indexes, N+1 query patterns, and full table scans are among the most common causes of slow APIs. A single slow query can add hundreds of milliseconds.
External API calls. If your API calls a third-party service, its latency becomes your latency. Unreliable external dependencies drag down your response time.
Inefficient serialization. Converting large objects to JSON or XML takes time. Deeply nested structures and large payloads make it worse.
Large payloads. Sending megabytes of data over a slow connection takes time. Pagination, compression, and field filtering reduce payload size.
Synchronous processing. If your API waits for a slow operation to complete before responding, the user waits too. Async patterns and background jobs fix this.
Cold starts. Serverless functions that have not run recently take longer to initialize. This adds hundreds of milliseconds to the first request.
Resource contention. When CPU, memory, or I/O is shared across many requests, performance degrades under load.
Network distance. A server in one region serving users in another adds latency. Content delivery networks and edge computing reduce this.
Memory leaks. Over time, memory leaks degrade performance. Restarting the process temporarily fixes it, but the root cause remains.
Inefficient algorithms. Poorly chosen data structures or algorithms scale badly. What works with 100 records fails with 100,000.
How to Improve API Response Time
Improving response time is a process. Start by measuring, then target the biggest bottleneck, then verify the change.
Add database indexes. The single highest-impact fix for many APIs. Identify slow queries and add indexes on the columns they filter or join on.
Fix N+1 queries. If your code fetches a list, then loops through it to fetch related records one at a time, you have an N+1 problem. Use batch queries or joins.
Cache aggressively. Cache responses, database queries, and computed values. Use Redis, Memcached, or in-memory caches. Set appropriate TTLs and invalidation rules.
Paginate large results. Never return thousands of records in a single response. Return pages of 20 to 100 items with a cursor or offset.
Compress responses. Gzip or Brotli compression reduces payload size by 60% to 80% for text-based responses.
Use asynchronous processing. For long-running tasks, return a job ID immediately and process in the background. Let the client poll for status.
Reduce external calls. Batch or cache third-party API calls where possible. If an external service is slow, consider replacing it or adding a fallback.
Optimize serialization. Use efficient serializers. For large objects, consider streaming JSON instead of building the entire structure in memory.
Move closer to users. Deploy in multiple regions. Use a CDN for static assets. Edge functions reduce round-trip time.
Tune connection pooling. Reuse database and HTTP connections instead of opening new ones per request.
Set timeouts. Every external call should have a timeout. Without one, a slow dependency can hang your entire API.
Monitor continuously. Performance regressions happen. Set alerts for response time thresholds and investigate spikes.
API Response Time Benchmarks by Industry
Different industries have different expectations. Here are typical targets.
| Industry | Typical Target (Server-Side) |
|---|---|
| E-commerce | 100ms to 200ms |
| Financial services | 50ms to 150ms |
| SaaS applications | 150ms to 300ms |
| Social media | 100ms to 250ms |
| Healthcare | 200ms to 500ms |
| IoT and telemetry | 50ms to 200ms |
These are starting points, not rules. A payments API and a profile picture API have different requirements. Match the target to the business impact of the call.
API Response Time and User Experience
Response time directly affects how users perceive your product. The relationship is not linear.
At 100ms, users perceive the system as instantaneous and at 300ms, they notice a slight delay but remain engaged. at 1 second, they feel a pause and may start to lose focus and at 3 seconds, many will abandon the action. At 10 seconds, most will leave.
Research from Nielsen Norman Group identified three key thresholds:
- 0.1 seconds: Feels instant. No feedback needed.
- 1 second: Feels responsive. Users notice the delay but stay in flow.
- 10 seconds: Limit of attention. Users will switch tasks if they have to wait longer.
For APIs that power user interfaces, the practical target is under 200ms for the server-side portion. This leaves room for network latency and rendering without pushing the total experience past the 1-second threshold.
Slow APIs also affect search rankings. Google uses page experience signals, and slow API responses that delay page rendering hurt Core Web Vitals.
Monitoring and Alerting for API Response Time
Measuring once is not enough. Response time changes with traffic, deployments, and data growth. Continuous monitoring keeps you ahead of regressions.
Set baselines. Record typical response times for each endpoint during normal traffic. This becomes your reference point.
Define thresholds. Set alerts for p95 and p99 response times, not just averages. Averages hide slow outliers that real users experience.
Track percentiles. The median (p50) tells you what most users experience. The 95th percentile (p95) tells you what the slowest 5% experience. The 99th percentile (p99) catches the worst cases.
Alert on anomalies. A sudden spike in response time often signals a deploy issue, a database problem, or an external dependency failure.
Correlate with deployments. Track response time before and after each release. Regressions are easier to fix when caught early.
Review regularly. Set a weekly or monthly review of slow endpoints. Performance work is ongoing, not a one-time project.
API Response Time: Common Mistakes
Even experienced teams make these mistakes. Avoiding them saves time and prevents false conclusions.
Measuring only averages. Averages hide outliers. Always track percentiles.
Ignoring client-side time. Server-side metrics can look great while users experience slow responses due to network or rendering issues.
Optimizing without measuring. Do not guess where the bottleneck is. Profile first.
Testing only with small datasets. Queries that are fast with 1,000 rows may be slow with 1 million. Test with realistic data volumes.
Forgetting about cold starts. Serverless functions behave differently on first invocation. Account for this in your benchmarks.
Neglecting external dependencies. Your API is only as fast as its slowest dependency. Monitor third-party services.
Setting unrealistic targets. Aiming for 10ms on a complex query is not always possible. Set targets based on use case, not aspiration.
Not accounting for peak load. Response time under light load is not the same as under heavy load. Test at expected peak.
API Response Time: Frequently Asked Questions
What is a good API response time?
For most customer-facing web APIs, a server-side response time under 200ms is a good target. Under 100ms feels instant. Over 1 second feels slow and can hurt conversion and engagement.
What is the difference between latency and response time?
Latency is the time for a packet to travel between two points. Response time is the total time from request to completed response. Response time includes latency plus server processing time.
How do I measure API response time?
Use APM tools for code-level detail, synthetic monitoring for baseline checks, real user monitoring for actual user experience, and load testing for capacity planning. Track percentiles, not just averages.
Why is my API response time slow?
Common causes include unoptimized database queries, N+1 query patterns, external API calls, large payloads, synchronous processing, cold starts, and resource contention. Measure first to find the actual bottleneck.
What is p95 and p99 response time?
p95 is the response time below which 95% of requests fall. p99 is the same for 99%. They reveal the experience of your slowest users, which averages hide.
How can I reduce API response time quickly?
Add database indexes, fix N+1 queries, enable caching, compress responses, and paginate large results. These changes often produce the biggest improvements with the least effort.
Does API response time affect SEO?
Indirectly, yes. Slow APIs delay page rendering, which hurts Core Web Vitals and page experience signals. Faster APIs contribute to better search performance.
What tools can I use to monitor API response time?
Datadog, New Relic, Dynatrace, and Grafana are common for APM. Pingdom, UptimeRobot, and Checkly are used for synthetic monitoring. OpenTelemetry and Jaeger are used for distributed tracing.
Conclusion
API response time is more than a technical metric. It shapes how users experience your product. Measure it consistently, break it down by phase, and target the biggest bottleneck first. A fast API is not an accident. It is the result of deliberate design, continuous monitoring, and disciplined optimization.
Read More Related Articles :
- 350+ Cold Emails That Get Responses | Proven Templates, Tips & Examples In 2026
- 350+ How to Calculate Response Rate | Formula, Examples & Easy Guide In 2026
- 350+ Cold Email Response Rate | Benchmarks, Averages & Ways to Improve In 2026

Sarah Mitchell is a blogger and writer at RespondLabs.com, turning everyday ideas into clear, engaging stories.
She enjoys exploring fresh perspectives and creating content that keeps readers curious and informed.