Quick Answer
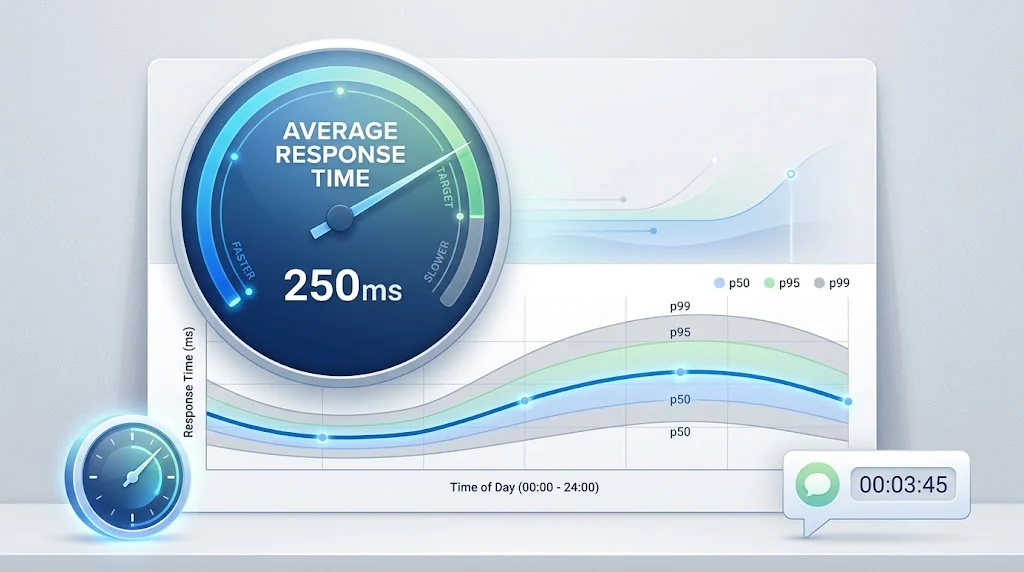
Average response time is the mean time between a request and its response. Calculate it by dividing total response time by the number of requests. Benchmarks vary widely: live chat under 1 minute, email under 12 hours, APIs under 200ms, and emergency services under 8 minutes in urban areas.
Every interaction has a clock attached to it. A customer sends a message and waits. A user taps a button and waits. A caller dials emergency services and waits. The length of that wait shapes the entire experience.
Average response time is the metric that captures this wait. It is used in customer support dashboards, API monitoring tools, emergency service reports, and sales pipelines. It is simple to calculate but surprisingly easy to misinterpret.
The problem is that averages hide more than they reveal. A 2-hour average could mean every ticket gets answered in 2 hours, or half get answered in 10 minutes while the other half sit for 4 hours. Same number. Very different experiences.
This article covers how to calculate average response time accurately, what benchmarks to expect across different contexts, why averages can mislead, and how to improve response times where they matter most.
What Is Average Response Time?
Average response time is the mean duration between the start of a request and the completion of a response. It is expressed in seconds, minutes, hours, or milliseconds, depending on the context.
The formula is simple:
Average Response Time = Total Response Time ÷ Number of Responses
For example, if a support team handles four tickets with response times of 5, 15, 25, and 55 minutes, the total is 100 minutes. Divided by 4, the average is 25 minutes.
That number summarizes the group. It does not describe any single ticket. The 55-minute ticket is an outlier that pulls the average up. The median, which is 20 minutes, tells a different story.
Average response time appears in many contexts, but the definition of “response” changes. In customer support, it may mean the first reply. In APIs, it means the full response payload and In emergency services, it means arrival on scene. Always check which definition is being used.
How to Calculate Average Response Time Correctly
The calculation is straightforward. The complexity comes from defining the start and end points.
Step 1: Define the start point. When does the clock start? For support tickets, it is when the ticket is created and For APIs, it is when the request is sent. For emergency calls, it is when the call connects.
Step 2: Define the end point. When does the clock stop? For support, it may be the first reply or the final resolution and For APIs, it is when the last byte arrives. For emergency services, it is when the first responder arrives.
Step 3: Sum the individual response times. Add up every measured duration.
Step 4: Divide by the number of responses.
Step 5: Segment before you average. A blended average across all channels, teams, or priority levels hides important differences. Calculate averages for each segment separately.
Step 6: Report median and percentiles alongside the mean. The average alone is not enough.
Worked example:
A support team handles six tickets:
- Ticket 1: 8 minutes
- Ticket 2: 12 minutes
- Ticket 3: 20 minutes
- Ticket 4: 35 minutes
- Ticket 5: 45 minutes
- Ticket 6: 180 minutes
Total = 300 minutes. Number of tickets = 6. Average = 50 minutes.
Median = 27.5 minutes (average of the two middle values, 20 and 35). The 180-minute outlier pulls the mean far above the median.
This is why reporting both is standard practice.
Average Response Time vs Other Metrics
Average response time is one of several related metrics. Each tells a different part of the story.
Median response time. The middle value when all response times are sorted. Less affected by outliers than the mean.
First response time (FRT). The time until the first reply. Common in customer support and sales.
Resolution time. The total time to fully resolve an issue, not just respond to it.
p95 and p99 response time. The response time below which 95% or 99% of requests fall. These reveal the experience of your slowest users.
Service level agreement (SLA). A contractual target for response time. SLAs often specify both an average and a maximum.
Averages hide outliers. Percentiles reveal them. Use both.
Average Response Time Benchmarks by Context
Different contexts have different expectations. Here are realistic benchmarks for 2026.
Customer Service
| Channel | Typical Average Response Time |
|---|---|
| Live chat | Under 1 minute |
| Phone | Under 2 minutes (wait time) |
| Social media | 1 to 4 hours |
| 4 to 24 hours | |
| Support ticket | 6 to 24 hours |
A 2023 benchmark report found that the average first response time across industries was around 12 hours for email tickets. Top performers averaged under 2 hours.
Customer expectations are rising. A survey found that 90% of customers expect an immediate response to a support question. That is not always achievable, but it shows the pressure support teams face.
APIs and Software
| Response Time | User Perception |
|---|---|
| Under 100ms | Instant |
| 100ms to 200ms | Fast |
| 200ms to 500ms | Acceptable |
| 500ms to 1s | Noticeable delay |
| Over 1s | Slow |
| Over 3s | Frustrating |
For APIs, averages are notoriously misleading. A 200ms average with a p99 of 5 seconds means 1 in 100 users waits 5 seconds. That is a poor experience for a meaningful minority.
Emergency Services
| Area Type | Typical Response Time |
|---|---|
| Urban | 4 to 8 minutes |
| Suburban | 6 to 12 minutes |
| Rural | 10 to 20 minutes or more |
These numbers are targets, not guarantees. Traffic, weather, and distance all affect actual response time.
Sales and Outreach
For inbound leads, speed matters enormously. Responding to a lead within 5 minutes makes it 21 times more likely to qualify than waiting 30 minutes. The average response time for B2B sales teams, however, is often measured in hours or days.
Hiring and Recruiting
| Stage | Typical Response Time |
|---|---|
| Application acknowledgment | 1 to 3 days |
| First interview invitation | 1 to 2 weeks |
| Decision after final interview | 1 to 2 weeks |
| Total hiring process | 3 to 6 weeks |
A 2023 survey found that 60% of job seekers expect a response within one week of applying. Many companies fail to meet this expectation.
Why Average Response Time Can Be Misleading
Averages are easy to calculate and easy to report. They are also easy to misinterpret.
Outliers skew the average. One very slow response can pull the average up significantly. The median is more robust.
Averages hide distribution. A 5-hour average could mean everyone waits 5 hours, or half wait 1 hour and half wait 9 hours. These are very different experiences.
Averages hide the tail. In software, the slowest 1% of requests often cause the most user frustration. Averages do not show this.
Averages across segments are meaningless. An average across all customer tiers, channels, and regions blurs the picture. Segment first.
Averages encourage gaming. If a team is measured on average response time, they may respond quickly to easy tickets and delay hard ones. The average improves. The experience does not.
Better alternatives:
- Report median and p95 alongside the mean
- Segment by priority, channel, and customer tier
- Track the percentage of responses within SLA
- Monitor trends over time, not just snapshots
How to Improve Average Response Time
Improving response time is not always about working faster. It is often about removing bottlenecks.
For Customer Service
- Use canned responses for common questions
- Route tickets by priority and expertise
- Set clear SLAs by channel and tier
- Staff adequately during peak hours
- Use AI triage to categorize and route tickets faster
- Build a knowledge base so customers can self-serve
For APIs and Software
- Add database indexes and fix N+1 queries
- Cache responses and computed values
- Paginate large results
- Use asynchronous processing for slow operations
- Deploy closer to users with CDNs and edge functions
- Set timeouts on every external call
Sales
- Automate lead routing and assignment
- Use templates for quick initial replies
- Set response time targets and track them
- Alert reps when a high-value lead arrives
- Use chatbots to acknowledge inquiries instantly
For Hiring
- Acknowledge every application automatically
- Set a clear timeline and communicate it
- Batch interview scheduling to reduce delays
- Close the loop with all candidates, even rejected ones
Common Mistakes When Tracking Average Response Time
Tracking only the average. Always report median and percentiles.
Ignoring segments. A blended average hides which channels, teams, or regions are struggling.
Setting unrealistic targets. A 1-minute average response time for email support is not sustainable. Set targets based on channel and context.
Measuring the wrong start point. Does the clock start when the customer writes, or when the ticket enters your system? The answer changes the number.
Not accounting for business hours. A ticket received at 5 p.m. on Friday may sit until Monday. Decide whether to count business hours or calendar hours.
Using averages to evaluate individuals. Response time is a team metric. Using it to rank agents can encourage gaming and harm quality.
Forgetting about quality. A fast response that does not solve the problem is worse than a slow response that does. Measure resolution alongside response.
Copy-Ready Template: Response Time Report
Use this template to document and share response time metrics consistently.
text
Report period: [Date range]
Context: [Customer support / API / Sales / Hiring]

Total requests: [Number]
Total response time: [Sum in minutes or ms]
Average response time: [Total ÷ Requests]
Median response time: [Middle value]
p95 response time: [Value below which 95% fall]
p99 response time: [Value below which 99% fall]

Breakdown by segment:
- Segment 1: [Average / Median / p95]
- Segment 2: [Average / Median / p95]

Percentage within SLA: [Number]%
Notes: [Any relevant context, such as holidays or incidents]
FAQs
What is a good average response time?
It depends on the context. For customer support email, under 12 hours is typical, under 2 hours is strong and for live chat, under 1 minute. For APIs, under 200ms server-side.It is For emergency services, under 8 minutes in urban areas.
How do I calculate average response time?
Add up all individual response times and divide by the number of responses. Segment your data before averaging to avoid misleading results.
Why is average response time misleading?
Averages are skewed by outliers and hide the distribution of responses. A 5-hour average could mean everyone waits 5 hours, or half wait 1 hour and half wait 9 hours. Always report median and percentiles alongside the mean.
What is the difference between average response time and first response time?
First response time measures only the first reply. Average response time may include all replies or the full resolution. Check which metric is being reported.
What is p95 response time?
p95 is the response time below which 95% of requests fall. It reveals the experience of your slowest users, which averages hide.
How can I improve average response time?
Remove bottlenecks rather than working faster. Use templates, automate routing, cache responses, and set realistic SLAs. Segment your data to identify where the biggest delays are.
Does average response time affect SEO?
Indirectly. Slow API responses delay page rendering, which hurts Core Web Vitals and page experience signals. Faster responses contribute to better search performance.
Should I use business hours or calendar hours?
It depends on your audience and your SLA. For B2B support, business hours are common. For consumer-facing services, calendar hours may be more appropriate. Be consistent and document your choice.
Conclusion
Average response time is a useful summary metric, but it is not the whole story. It tells you the mean, not the experience. Pair it with median and percentiles, segment by channel and priority, and track trends over time. When you measure response time accurately, you can improve it where it matters most.
Read More Related Articles :
- 350+ Cold Emails That Get Responses | Proven Templates, Tips & Examples In 2026
- 350+ How to Calculate Response Rate | Formula, Examples & Easy Guide In 2026
- 350+ Cold Email Response Rate | Benchmarks, Averages & Ways to Improve In 2026

James Wilson is a passionate blogger and writer at RespondLabs.com, sharing fresh perspectives on technology, business and everyday digital trends. His writing combines clear insights with an engaging, reader-friendly style.