Quick Answer
NPS response rate is the percentage of people who answer your Net Promoter Score survey out of everyone who received it. The B2B average sits at 12.4%, while in-app surveys reach 27% and SMS can hit 31%. A rate above 15% for email is considered good.
You send out an NPS survey. You wait. A few responses trickle in. Then nothing. The score looks fine, but you cannot shake the feeling that you are only hearing from your happiest customers.
That feeling is usually correct. NPS response rates have been declining for years. Email surveys that once averaged 20% to 25% now sit at 10% to 15%. In B2B SaaS, quarterly relationship surveys often fall below 10%.
The problem is not just the number. It is who responds. Promoters reply. Detractors stay silent. Passives ignore the email. The score goes up while the customer base quietly slips away.
This article covers what NPS response rate means, how to calculate it, what benchmarks to aim for, and how to improve it without bribing customers or spamming their inboxes.
What Is NPS Response Rate?
NPS response rate measures how many people completed your Net Promoter Score survey out of everyone who received it. It is expressed as a percentage.
The metric matters because NPS is only as reliable as the sample behind it. A score based on 5% of customers is a weak signal. A score based on 30% of customers is a strong one.
But here is the nuance most guides miss: a high response rate made up entirely of happy power users is worse than a lower rate that represents your whole base. The goal is not just more responses. It is more representative responses.
NPS response rate is different from NPS itself. NPS measures loyalty by subtracting the percentage of detractors from the percentage of promoters. Response rate measures participation. You need both numbers to trust the score.
How to Calculate NPS Response Rate
The basic formula is simple:
NPS Response Rate = (Number of Responses ÷ Number of Surveys Delivered) × 100
For example, if you send an NPS survey to 1,000 customers and 140 complete it, your response rate is 14%.
The details matter, though. Here is what to include and exclude.
Use delivered surveys, not sent surveys. If 50 emails bounced, they never reached the recipient. Subtract them from the denominator. Counting bounces inflates your denominator and lowers your rate artificially.
Decide what counts as a response. A completed survey counts. A partial response may count separately. A click without a score does not count as a completed response.
Exclude ineligible recipients. If someone unsubscribed or was not a customer during the survey period, remove them from the sample.
Track over time. A single response rate is a data point. Four quarters of data shows a trend. Compare quarter over quarter to spot declines early.
For in-app surveys, the denominator changes. Instead of delivered emails, you count unique views. The formula becomes:
NPS Response Rate = (Number of Responses ÷ Unique Views) × 100
This is why in-app surveys often report higher rates. The survey appears inside the product, where the user is already engaged.
2026 NPS Response Rate Benchmarks
Response rates vary wildly by channel, industry, and survey type. Here is where the numbers land in 2026.
| Channel | Average Response Rate | What It Signals |
|---|---|---|
| SMS | 31% to 50% | Highest engagement, best for transactional surveys |
| In-app | 20% to 35% | Strong for product feedback, users are already engaged |
| Embedded email | 15% to 25% | Good for relationship surveys with loyal customers |
| Linked email | 10% to 18% | Standard for most NPS programs |
| Website | 8% to 15% | Lowest, easily ignored |
The B2B industry average sits at 12.4%, with a range of 4.5% to 39.3% across companies. CustomerGauge clients regularly achieve response rates above 60%, but those are outliers with dedicated NPS programs.
For most teams, a good NPS response rate is roughly 15% or higher for a relationship email survey and 20% to 30% or more for an in-app or transactional survey.
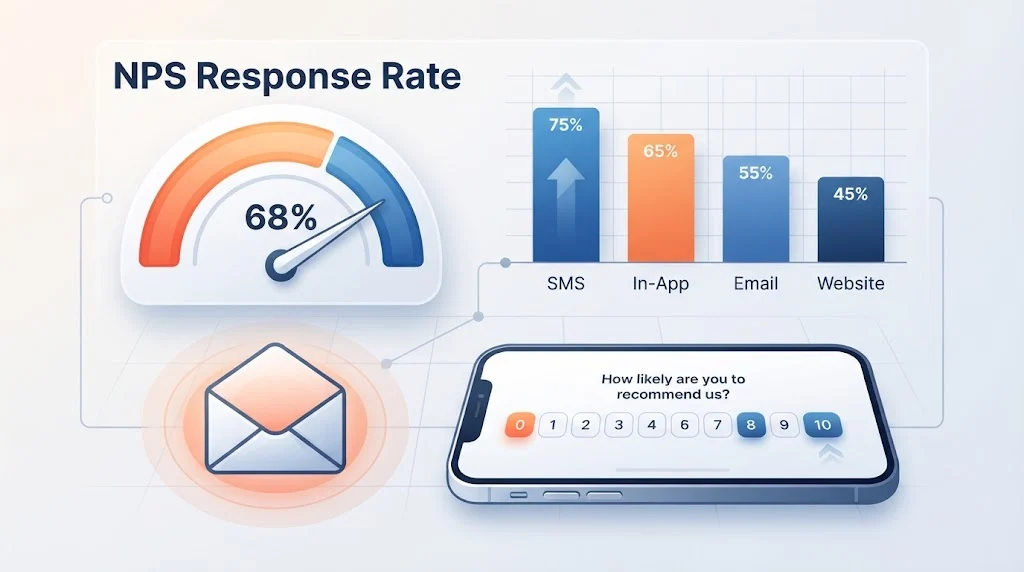
The channel you choose sets the ceiling before you write a single word. In-app surveys double the response rate of email surveys (27% vs 14%), and SMS surveys triple it (31%).
Why NPS Response Rates Are Declining
Response rates have dropped from 20% to 25% in 2019 to 10% to 15% in 2025. Some industries have seen steeper declines. Financial services and telecom programs that once achieved 30% or higher now struggle to reach 12%.
Three forces drive the decline.
Survey fatigue. The average consumer receives three to five feedback requests per week. Post-purchase surveys, CSAT surveys, NPS surveys, app store prompts, delivery ratings. Each one takes only a minute, but the cumulative demand on attention is substantial. Customers develop an automatic dismissal reflex that applies across all brands.
Timing mismatch. A relationship survey sent on a calendar cadence rarely coincides with a moment the customer actually has an opinion. If nothing notable happened this month, there is no reason to reply.
No perceived payoff. Customers who filled out a survey before and saw nothing change assume this one goes into the same void. The rational move is to skip it.
None of these problems are about the NPS question itself. They are about how, when, and why you ask.
The Hidden Threat: Nonresponse Bias
Low response rates do not just reduce your data. They systematically bias it.
If only your happiest customers respond, your scores are not wrong. They are incomplete. Silent users do not reply. Disengaged customers drop off. Unhappy users ignore surveys altogether.
This is nonresponse bias. It makes your NPS run higher than reality and keeps you blind to churn risk. A company can celebrate a rising NPS while losing customers who never bothered to answer.
The math is stark. If your response rate is 25%, there is a 75% potential bias introduced by non-respondents. Standard statistical adjustments cannot fix this if the missing respondents differ systematically from those who replied.
At CustomerGauge, one crucial predictor of customer churn is a loss of signal. If an account never responds to a survey, they could be at the door. Silence is not neutral. It is a warning sign.
Moving response rate from 8% to 20% does not just add data. It changes who you hear from.
How to Improve Your NPS Response Rate
Improving response rate is not about tricks. It is about respecting the customer’s time, attention, and context. Here is what works.
Trigger surveys off events, not dates. Event-based timing is the biggest lever. Send a transactional NPS after a support ticket is resolved, after onboarding, or after a key milestone. The customer has a fresh experience to rate. ProfitWell’s data puts the median NPS response rate at 14.2% for quarterly batch surveys and 41.8% for event-triggered automated surveys.
Move to in-product or SMS channels where possible. In-app surveys reach users where they are already engaged. SMS reaches them where they actually read. Both outperform email significantly.
Keep the survey to one question plus an open follow-up. The standard NPS question is “How likely are you to recommend us to a friend or colleague?” Add one optional open-ended field. Two questions is the proven sweet spot.
Personalize the invitation. Use the customer’s name. Reference their specific product, plan, or recent interaction. A generic “How likely are you to recommend us?” email lands in an inbox trained to archive exactly that subject line.
Send at the right time. Tuesday or Wednesday between 9 and 11 a.m. in the customer’s time zone works best. Avoid holidays, Mondays, and Friday afternoons.
Follow up once, maybe twice. A single reminder can significantly boost response rates. Keep the campaign duration short, ideally around two weeks, and send up to three reminders spaced a few days apart.
Close the feedback loop. Customers who filled out a survey before and saw nothing change assume this one goes into the void. Let them know their input was heard. This encourages participation in future surveys.
Limit requests to once per quarter. Prevent fatigue by rotating recipients and avoiding over-surveying the same accounts.
Common Mistakes That Hurt NPS Response Rate
Even experienced CX teams make these mistakes. Fixing them can double your response rate.
Treating response rate as a vanity metric. A 30% rate from happy users is worse than a 12% rate that represents your whole base. What matters is who responds, not just how many.
Using sent emails in the denominator. Bounced emails never reached the recipient. Subtract them from the denominator.
Sending quarterly relationship surveys on autopilot. Calendar-based surveys rarely coincide with a moment the customer has an opinion. Switch to event-triggered surveys where possible.
Making the survey too long. One question plus an optional follow-up. Anything more reduces completion rates.
Ignoring non-respondents. Silence is data. If an account never responds, they may be at risk of churn. Flag them and investigate.
Not segmenting by channel. Email, in-app, and SMS have different benchmarks. Do not compare an email response rate to an SMS response rate.
Forgetting to close the loop. Customers who see no change after giving feedback stop giving feedback. Communicate what you did with their input.
NPS Response Rate by Industry
Industry context matters. A 12% response rate might be average in SaaS but low in manufacturing.
SaaS and technology: 5% to 15% for email surveys, 20% to 35% for in-app. The most saturated inbox category.
Financial services: 10% to 15%. Heavily gated by compliance and inbox security tools. Programs that once achieved 30% now struggle to reach 12%.
Manufacturing and industrial: 15% to 25%. Less inbox saturation, higher responsiveness.
Healthcare: 10% to 18%. Heavy spam filtering and strict IT policies suppress response rates.
Ecommerce: 10% to 20% for email, 25% to 40% for post-purchase in-app surveys. Transactional surveys perform much better than relationship surveys.
Professional services: 15% to 25%. Less crowded, with higher individual responsiveness.
The spread between industries reflects inbox saturation, not copy quality. A SaaS founder gets dozens of survey requests per month. A manufacturing operations manager gets a handful.
NPS Response Rate vs Other Survey Metrics
NPS response rate is not the same as open rate, click-through rate, or completion rate. Understanding the difference helps you diagnose problems accurately.
Open rate measures how many people opened the email. Apple Mail Privacy Protection inflates open rates by pre-loading tracking pixels. Treat open rate as directional, not precise.
Click-through rate measures how many people clicked a link in the email. For NPS surveys, this is less relevant because the survey is usually embedded or linked directly.
Completion rate measures how many people who started the survey finished it. A high response rate with a low completion rate suggests the survey is too long or confusing.
NPS score measures loyalty, not participation. A high NPS with a low response rate is unreliable. A moderate NPS with a high response rate is more trustworthy.
Track all four metrics together. They tell a more complete story than any single number.
Copy-Ready NPS Survey Templates
These templates are starting points. Customize them for your brand and audience.
Template: Standard Email NPS Survey
text
Subject: Quick question about your experience with [Product]

Hi [Name],

On a scale of 0 to 10, how likely are you to recommend [Product] to a friend or colleague?

[0-10 scale]

What is the main reason for your score?

[Open text field]

Thank you for your feedback. It helps us improve.

[Your name]
Template: In-App NPS Prompt
text
How likely are you to recommend [Product] to a colleague?

[0-10 scale]

Thanks! Want to tell us why?

[Open text field]
Template: SMS NPS Survey
text
Hi [Name], quick question from [Company]: On a scale of 0-10, how likely are you to recommend us? Reply with a number. Reply STOP to opt out.
Template: Follow-Up Reminder
text
Subject: Re: Quick question about your experience

Hi [Name],

Just a gentle reminder to share your feedback. It takes less than 30 seconds and helps us improve.

[Survey link]

Thank you.

[Your name]
Frequently Asked Questions
What is a good NPS response rate in 2026?
A good NPS response rate is roughly 15% or higher for a relationship email survey and 20% to 30% or more for an in-app or transactional survey. The B2B industry average is 12.4%.
Why is my NPS response rate so low?
Low response rates usually come from survey fatigue, poor timing, or a lack of perceived payoff. Customers receive three to five feedback requests per week. If your survey arrives at a random moment with no clear reason to reply, it gets ignored.
How do I calculate NPS response rate?
Divide the number of completed responses by the number of surveys delivered. Multiply by 100. Use delivered surveys, not sent surveys. Exclude bounces and ineligible recipients from the denominator.
Does a low response rate affect my NPS score?
Yes. A low response rate often means you are only hearing from your happiest customers. This makes your NPS run higher than reality and keeps you blind to churn risk. Nonresponse bias is a bigger threat to NPS reliability than the wording of the question.
Should I offer incentives to improve NPS response rate?
Incentives can work, but they can also attract low-quality responses from people who only want the reward. A better approach is to fix timing, channel, and relevance first. If you do offer an incentive, keep it small and relevant.
What is the best channel for NPS surveys?
SMS surveys average 31% to 50% response rates. In-app surveys average 20% to 35%. Embedded email surveys average 15% to 25%. Linked email surveys average 10% to 18%. The best channel depends on your audience and the type of survey.
How often should I send NPS surveys?
Limit requests to once per quarter for relationship surveys. For transactional surveys, trigger them after key events but avoid over-surveying the same customer. Rotate recipients and respect frequency caps.
What is nonresponse bias in NPS?
Nonresponse bias occurs when the people who respond differ systematically from those who do not. In NPS, promoters are more likely to respond than detractors. This skews the score upward and hides problems. A higher response rate reduces nonresponse bias.
Conclusion
NPS response rate is not just a number. It is a measure of whether your feedback program actually represents your customers. A high response rate from a representative sample gives you a trustworthy score. A low response rate from happy users gives you a false sense of security. Fix your timing, choose the right channel, keep the survey short, and close the loop. Your NPS will become a signal you can act on, not just a number you report.
Read More Related Articles :
- 150+ Automatic Response Text Messages The Ultimate Guide to Auto Replies That Don’t Suck In 2026
- 150+ Automatic Response Outlook Messages: The Ultimate Guide to Auto Replies That Actually Work
- 130+ Best Replies For Every Email Response Time Tracking Situation In 2026

James Wilson is a passionate blogger and writer at RespondLabs.com, sharing fresh perspectives on technology, business and everyday digital trends. His writing combines clear insights with an engaging, reader-friendly style.