Quick Answer
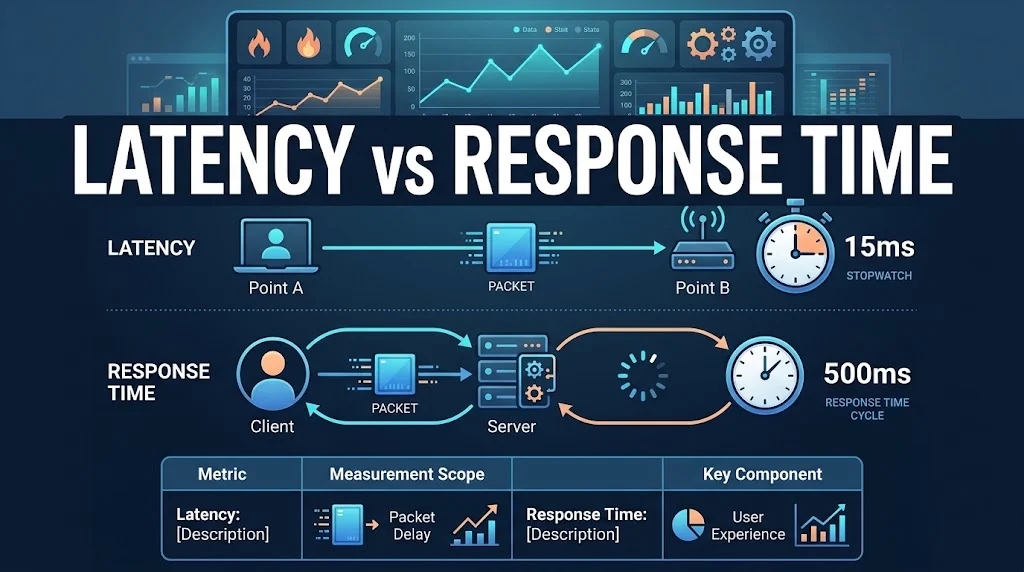
Latency is the time for data to travel from one point to another. Response time is the total time from sending a request to receiving a complete response. Response time includes latency plus server processing, queuing, and data transfer.
Two metrics get used interchangeably in performance conversations. Latency and response time. They sound similar. They are often reported side by side. But they measure different things, and confusing them leads to the wrong fixes.
A network engineer might say “latency is high” when they mean packets are taking a long route. A developer might say “response time is high” when they mean the database query is slow. Both statements use the same words but describe different problems.
The distinction matters because the solutions are different. High latency needs network optimization: better routing, closer servers, content delivery networks. High response time needs application optimization: faster queries, caching, efficient code.
This article explains what latency and response time actually mean, how they relate to each other, how to measure both, and how to improve each one. Whether you are debugging an API, tuning a database, or just trying to understand a performance dashboard, this guide gives you a clear framework.
What Is Latency?
Latency is the time it takes for a single unit of data to travel from one point to another. It is a measure of delay in the network. It is typically measured in milliseconds (ms).
When you send a packet from your computer to a server, latency is the time it takes for that packet to arrive. When the server sends a response back, latency is the time it takes for that response to arrive. In practice, latency usually refers to round-trip time (RTT), which is the time for a packet to travel to the destination and back.
Latency is not a single number. It is the sum of several components:
Propagation delay. The time for a signal to travel through the physical medium. This is limited by the speed of light. A signal traveling from New York to London covers roughly 5,500 kilometers. Even at the speed of light in fiber, that takes about 28 milliseconds one way.
Transmission delay. The time to push all the bits of a packet onto the wire. This depends on the packet size and the bandwidth of the link.
Processing delay. The time routers and switches take to examine packet headers and decide where to forward them.
Queuing delay. The time a packet waits in a router’s buffer before being transmitted. This grows when the network is congested.
Serialization delay. The time to convert data into signals for transmission.
Latency is a network-level metric. It describes how long the network takes to move data, independent of what the application does with it.
What Is Response Time?
Response time is the total time between a client sending a request and receiving a complete response. It is also measured in milliseconds. It includes latency plus everything else that happens between the request and the response.
That “everything else” includes:
- DNS resolution
- TCP handshake
- TLS handshake (for HTTPS)
- Sending the request over the network
- Server processing time
- Database queries
- External API calls
- Response serialization
- Sending the response back over the network
- Client-side rendering
Response time is what the user actually experiences. It is the metric that determines whether an interaction feels instant, acceptable, or slow.
Response time is sometimes called round-trip time (RTT) in casual conversation, but that is not accurate. RTT is a latency measurement. Response time is broader.
The Core Difference Between Latency and Response Time
The simplest way to understand the difference is this: latency is a component of response time.
Response Time = Latency + Processing Time + Transfer Time
Latency is the travel time. Processing time is what the server does with the request. Transfer time is how long it takes to send the response data back.
Here is a concrete example. You send a request to an API. The network takes 50ms to deliver the request. The server takes 200ms to process it. The response takes 50ms to travel back. Total response time: 300ms. Latency: 100ms (50ms each way). Processing time: 200ms.
Latency and response time are related but distinct. You can have low latency and high response time if the server is slow. You can have high latency and low response time if the server is fast and the payload is small.
| Feature | Latency | Response Time |
|---|---|---|
| Definition | Time for data to travel | Total time from request to response |
| Scope | Network only | Network + server + client |
| Measured by | Ping, RTT | APM, browser tools, synthetic monitoring |
| Affected by | Distance, routing, congestion | Latency + processing + payload size |
| Optimized by | CDNs, edge servers, better routing | Caching, indexing, async processing |
| User perception | Indirect | Direct |
Why the Confusion Exists
Latency and response time are often used interchangeably because, in simple systems, they are nearly the same. If a server does almost no processing and returns a tiny response, response time is dominated by latency. The two numbers look similar.
The confusion also comes from overlapping terminology. Network engineers talk about “latency” when they mean round-trip time. Application developers talk about “response time” when they mean server processing time. Monitoring tools sometimes label the same metric differently.
Cloud providers add to the confusion. AWS, Azure, and Google Cloud all publish latency numbers for their services. These numbers often measure the time for a request to reach the service and return, which is closer to response time than pure network latency.
The key is to ask what is being measured. If the measurement includes server processing, it is response time. If it measures only the network trip, it is latency.
How Latency and Response Time Are Measured
Different tools measure different things. Knowing which tool measures which metric prevents misinterpretation.
Ping. Measures round-trip latency at the ICMP layer. It does not include application processing. It is a pure latency measurement.
Traceroute. Maps the path packets take and shows latency to each hop. It is a latency diagnostic tool.
APM tools (Datadog, New Relic, Dynatrace). Measure response time at the application level. They break down time by function, database query, and external call. They are response time tools.
Browser developer tools. The Network tab shows total response time for each request, including DNS, TCP, TLS, waiting (server processing), and content download. It is a response time tool.
Synthetic monitoring (Pingdom, UptimeRobot). Sends requests from multiple locations and measures total response time. It includes both latency and server processing.
Real User Monitoring (RUM). Collects timing data from actual users. It measures the full response time experienced in the real world, including device and network variability.
Load testing (k6, JMeter, Locust). Simulates concurrent users and measures response time under load. It shows how response time changes as traffic increases.
For a complete picture, use both latency and response time tools. Ping and traceroute tell you about the network. APM and RUM tell you about the application.
How Latency Affects Response Time
Latency is one input into response time. When latency increases, response time increases, unless the server processing time decreases to compensate.
Latency affects response time in several ways:
Distance. The farther the server is from the client, the higher the latency. A server in New York serving a user in Tokyo adds 150ms to 200ms of latency per round trip. A server in the same city adds 1ms to 5ms.
Routing. Packets do not always take the shortest path. Poor routing can add dozens of milliseconds. BGP misconfigurations, congestion, and peering disputes all affect routing.
Congestion. When networks are busy, packets queue in router buffers. Queuing delay increases latency. This is why latency is higher during peak hours.
Protocol overhead. TCP handshakes and TLS negotiations add round trips before any data is exchanged. Each round trip adds latency. HTTP/3 with QUIC reduces this by combining handshakes.
Packet loss. When packets are lost, TCP retransmits them. Each retransmission adds latency. High packet loss dramatically increases response time.
Reducing latency is often the fastest way to reduce response time. Moving a server closer to users, using a CDN, or optimizing routing can cut latency without changing a single line of application code.
How Response Time Differs From Latency in Practice
Here is a practical scenario that shows the difference.
You run an API that returns a list of products. The server is in Virginia. A user in California sends a request.
- DNS resolution: 20ms
- TCP handshake: 30ms
- TLS handshake: 40ms
- Request transmission (Virginia to California): 35ms
- Server processing: 120ms
- Database query: 80ms
- Response serialization: 10ms
- Response transmission (California to Virginia): 35ms
- Client rendering: 50ms
Total response time: 420ms.
Latency (network round trip): 70ms (35ms each way).
Processing time (server + database + serialization): 210ms.
Client-side time (DNS + handshakes + rendering): 140ms.
If you only measured latency, you would see 70ms and think everything is fine. But the user waits 420ms. The difference is server processing and client-side overhead.
Now imagine you move the server to California.
- Latency drops from 70ms to 10ms.
- Total response time drops from 420ms to 360ms.
The improvement is real but modest. The server processing time is still 210ms. To make a bigger difference, you need to optimize the application, not just the network.
Conversely, if you optimize the database query from 80ms to 10ms, response time drops by 70ms. Combined with moving the server, response time drops to 290ms.
Both latency and response time matter. But they require different fixes.
When to Optimize Latency vs Response Time
Knowing which metric to optimize depends on where the bottleneck is.
Optimize latency when:
- The server is fast but users are far away
- Ping times are high but server processing is low
- Users report slowness only from certain regions
- The application is simple and does little processing
- You are serving static content or simple API responses
Optimize response time when:
- Server processing time dominates the total
- Database queries are slow
- External API calls add significant delay
- The application does complex computation
- Large payloads are being serialized and transferred
In many cases, you need to optimize both. A user in a distant region hitting a slow server experiences high latency and high response time. The fix requires both network optimization and application optimization.
How to Reduce Latency
Latency is a network problem. The fixes are network-level.
Use a content delivery network (CDN). A CDN caches content at edge locations close to users. This reduces the distance data must travel, cutting latency dramatically for static assets.
Deploy in multiple regions. If your users are global, deploy your application in multiple regions. Route users to the nearest one.
Use edge computing. Edge functions run code at the edge of the network, close to users. They reduce the round trips needed for dynamic content.
Optimize routing. Use anycast routing to direct users to the nearest server. Work with your ISP or cloud provider to ensure optimal paths.
Reduce round trips. Combine DNS, TCP, and TLS handshakes where possible. HTTP/3 with QUIC reduces handshake overhead.
Compress data. Smaller payloads take less time to transmit. Compression reduces the number of packets and the transmission delay.
Upgrade network links. Higher bandwidth reduces transmission delay for large payloads. Lower latency links (fiber vs satellite) reduce propagation delay.
How to Reduce Response Time
Response time is an application problem. The fixes are application-level.
Add database indexes. Slow queries are one of the most common causes of high response time. Indexes on frequently queried columns can cut query time from seconds to milliseconds.
Fix N+1 queries. If your code fetches a list, then loops through it to fetch related records one at a time, you have an N+1 problem. Use batch queries or joins.
Cache aggressively. Cache database queries, computed values, and API responses. Use Redis, Memcached, or in-memory caches.
Use asynchronous processing. For long-running tasks, return a job ID immediately and process in the background. Let the client poll for status.
Paginate large results. Never return thousands of records in a single response. Return pages of 20 to 100 items.
Compress responses. Gzip or Brotli compression reduces payload size by 60% to 80% for text-based responses.
Optimize serialization. Use efficient serializers. For large objects, consider streaming JSON instead of building the entire structure in memory.
Set timeouts on external calls. Without a timeout, a slow dependency can hang your entire response.
Profile your code. Use a profiler to find slow functions. Optimize the ones that consume the most time.
Monitor continuously. Set alerts for response time thresholds and investigate spikes.
Latency vs Response Time in Different Contexts
The relationship between latency and response time changes depending on the context.
Web browsing. Latency dominates for small pages with few resources. Response time dominates for pages with many resources, large images, and slow APIs.
API calls. Latency matters for small, fast APIs. Response time matters for complex APIs with database queries and external calls.
Gaming. Latency is critical. A 50ms increase in latency is noticeable. Response time matters less because game servers do minimal processing per frame.
Video streaming. Latency matters for live streams. Response time matters for buffering and startup. Both affect the experience.
Database queries. Latency is the network trip between application and database. Response time is the query execution time plus latency. Query optimization reduces response time without changing latency.
File transfers. Latency matters for small files. Bandwidth matters for large files. Response time includes both.
Common Mistakes When Measuring Latency and Response Time
Assuming they are the same. They are not. Latency is one component of response time.
Measuring only one. A fast ping does not mean the application is fast. A fast API does not mean the network is healthy. Measure both.
Using the wrong tool. Ping measures latency, not response time. APM measures response time, not pure latency. Use the right tool for the question.
Ignoring percentiles. Averages hide outliers. Track p50, p95, and p99 for both metrics.
Forgetting about client-side time. Response time includes client rendering. Server-side metrics alone do not tell the full story.
Not accounting for load. Latency and response time both change under load. Test at expected peak.
Overlooking DNS and TLS. These add round trips before any data is exchanged. They are part of response time and contribute to perceived latency.
Blaming the network for everything. High response time is often an application problem, not a network problem. Profile before you optimize.
Copy-Ready Template: Latency and Response Time Report
Use this template to document both metrics consistently.
text
Report period: [Date range]
Context: [API / Web / Database / Network]

Latency metrics:
- Average RTT: [ms]
- p50 RTT: [ms]
- p95 RTT: [ms]
- p99 RTT: [ms]
- Packet loss: [%]

Response time metrics:
- Average response time: [ms]
- p50 response time: [ms]
- p95 response time: [ms]
- p99 response time: [ms]

Breakdown:
- DNS: [ms]
- TCP handshake: [ms]
- TLS handshake: [ms]
- Server processing: [ms]
- Database: [ms]
- External calls: [ms]
- Response transfer: [ms]
- Client rendering: [ms]

Bottleneck: [Latency / Processing / Transfer / Client]
Notes: [Any relevant context]
Latency vs Response Time: Frequently Asked Questions
What is the main difference between latency and response time?
Latency is the time for data to travel from one point to another. Response time is the total time from sending a request to receiving a complete response. Response time includes latency plus server processing, queuing, and data transfer.
Is latency always part of response time?
Yes. Latency is a component of response time. Response time equals latency plus processing time plus transfer time.
Can response time be lower than latency?
No. Response time includes latency, so it cannot be lower than latency. If you see response time lower than latency, you are measuring different things.
How do I measure latency?
Use ping or traceroute for network latency. These tools measure round-trip time at the ICMP layer and show the path packets take.
How do I measure response time?
Use APM tools, browser developer tools, synthetic monitoring, or real user monitoring. These tools measure the full time from request to response, including server processing and client rendering.
Which is more important for user experience?
Response time is what users actually experience. Latency is one input into response time. Both matter, but response time is the metric that directly affects perceived speed.
How can I reduce latency?
Use a CDN, deploy in multiple regions, use edge computing, optimize routing, reduce round trips, and compress data. Latency is a network problem with network solutions.
How can I reduce response time?
Add database indexes, fix N+1 queries, cache aggressively, use asynchronous processing, paginate results, compress responses, and set timeouts on external calls. Response time is an application problem with application solutions.
Conclusion
Latency and response time are not the same thing, even though they are often used interchangeably. Latency is the travel time. Response time is the total time from request to response. Latency is one component of response time, but it is not the only one. Measure both, understand which bottleneck you are facing, and apply the right fix. When you do, you improve the experience where it actually matters.
Read More Related Articles :
- 350+ Cold Emails That Get Responses | Proven Templates, Tips & Examples In 2026
- 350+ How to Calculate Response Rate | Formula, Examples & Easy Guide In 2026
- 350+ Cold Email Response Rate | Benchmarks, Averages & Ways to Improve In 2026

Sarah Mitchell is a blogger and writer at RespondLabs.com, turning everyday ideas into clear, engaging stories.
She enjoys exploring fresh perspectives and creating content that keeps readers curious and informed.