Quick Answer
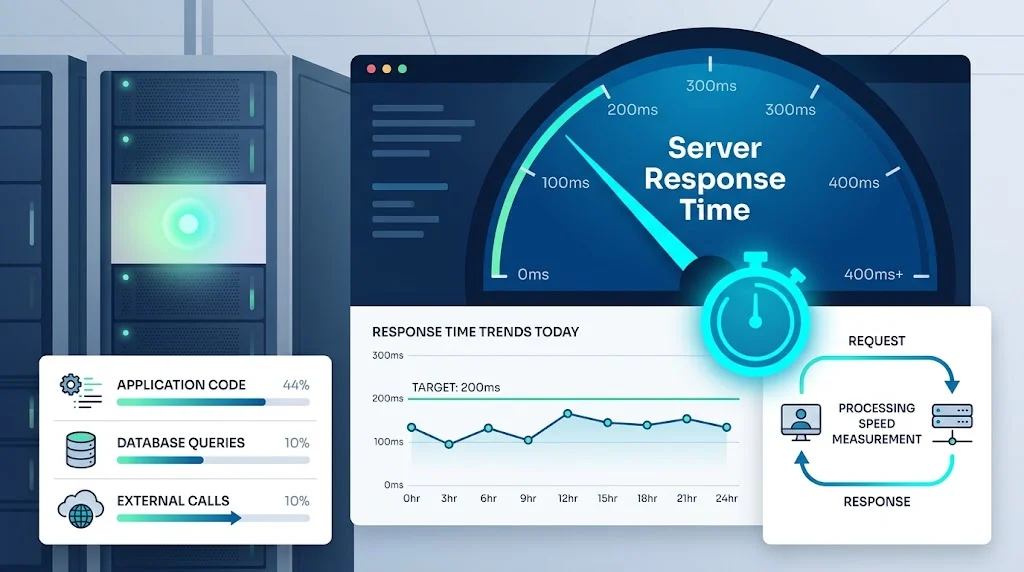
Server response time is the time a server takes to process a request and send back the first byte of the response. It excludes network latency and client rendering. A good target is under 200ms for most web applications. Google recommends keeping it under 200ms for optimal performance.
You click a link. The page takes a moment to load. You are not sure if the delay is your internet, the website, or something else entirely. In most cases, the answer involves server response time.
Server response time measures how long a server takes to process a request after receiving it. It is the time the server spends thinking, querying databases, running application code, and preparing the response. It does not include the time for the request to travel across the network or the time for the browser to render the page.
This metric matters because it directly affects user experience, search rankings, and conversion rates. Google uses it as part of its Core Web Vitals, specifically through Time to First Byte (TTFB). A slow server response time drags down every page on your site, no matter how well-optimized the front end is.
This article explains what server response time actually measures, how it differs from related metrics, what benchmarks to aim for, and how to diagnose and fix slow server responses.
What Is Server Response Time?
Server response time is the duration between a server receiving a request and sending back the first byte of the response. It is measured in milliseconds (ms).
The clock starts when the server begins processing the request. It stops when the first byte of the response leaves the server. Everything in between counts toward server response time.
That window includes several server-side activities:
- Parsing the request
- Running application code
- Querying databases
- Calling external services
- Reading files from disk
- Serializing the response
- Preparing headers
Server response time does not include:
- DNS resolution
- TCP handshake
- TLS handshake
- Network travel time to and from the client
- Browser rendering time
- Client-side JavaScript execution
Server response time is sometimes called Time to First Byte (TTFB) in web performance circles. They are closely related but not identical. TTFB measures from the client’s perspective and includes network latency. Server response time measures only the server’s processing time. TTFB equals server response time plus network latency.
Server Response Time vs Other Metrics
Server response time is one of several metrics that describe the performance of a request. Each measures a different part of the journey.
| Metric | What It Measures | Includes Network? |
|---|---|---|
| Server response time | Time for server to process and send first byte | No |
| Time to First Byte (TTFB) | Time from request to first byte received | Yes |
| Latency | Time for data to travel between two points | Yes |
| Round-trip time (RTT) | Time for a packet to go to a destination and back | Yes |
| Total response time | Time from request to complete response | Yes |
| Page load time | Time for the full page to render | Yes |
Server response time is the piece of the puzzle that the application team controls. Network latency is the piece the infrastructure team controls. Client rendering is the piece the front-end team controls.
When a page feels slow, the first question is: where is the time going? If server response time is high, the problem is in the application. If TTFB is high but server response time is low, the problem is in the network.
How to Measure Server Response Time
Measurement is the first step toward improvement. Different tools measure different things.
APM tools (Datadog, New Relic, Dynatrace). These instrument your application code and measure server response time automatically. They break down time by function, database query, and external call. This is the most detailed view of server-side performance.
Server logs. Most web servers and frameworks log response time per request. Parsing these logs gives you a baseline and helps identify slow endpoints.
Browser developer tools. The Network tab shows “Waiting (TTFB)” for each request. This includes network latency plus server response time. To isolate server response time, subtract the network round-trip time.
Synthetic monitoring (Pingdom, UptimeRobot, Checkly). These tools send requests from multiple locations and measure TTFB. They give you a consistent external view of performance.
Real User Monitoring (RUM). RUM tools collect TTFB data from actual users. They show how server response time varies by device, location, and network.
Load testing (k6, JMeter, Locust). These simulate concurrent users and measure how server response time changes under load.
For a complete picture, combine APM for code-level detail, synthetic monitoring for baseline checks, and RUM for real-world experience. Track percentiles, not just averages.
Server Response Time Benchmarks
There is no universal threshold, but here are commonly cited benchmarks.
| Server Response Time | What It Means |
|---|---|
| Under 100ms | Excellent. Users perceive it as instant. |
| 100ms to 200ms | Good. Users do not notice a delay. |
| 200ms to 500ms | Acceptable. Slight delay but fine for most interactions. |
| 500ms to 1 second | Slow. Users may feel a pause. |
| Over 1 second | Poor. Users may lose focus or abandon. |
Google recommends a TTFB under 200ms for optimal performance. Since TTFB includes network latency, server response time should be well under 200ms to leave room for network travel.
Different types of requests have different targets:
- Static file serving: Under 50ms
- Simple API calls: Under 100ms
- Database-backed pages: Under 200ms
- Complex queries or reports: Under 500ms
- Search with multiple backends: Under 1 second
The right target depends on the use case. A homepage and a complex analytics dashboard have different requirements.
What Causes Slow Server Response Time
Slow server response time rarely has a single cause. Here are the most common culprits.
Unoptimized database queries. Missing indexes, N+1 query patterns, and full table scans are among the most common causes. A single slow query can add hundreds of milliseconds.
External API calls. If your server calls a third-party service, its latency becomes your server response time. Unreliable external dependencies drag down performance.
Inefficient code. Poorly chosen data structures, unnecessary loops, and expensive computations all add time.
Large payloads. Serializing large objects to JSON or XML takes time. Deeply nested structures make it worse.
Cold starts. Serverless functions that have not run recently take longer to initialize. This adds hundreds of milliseconds to the first request.
Resource contention. When CPU, memory, or I/O is shared across many requests, performance degrades under load.
Memory leaks. Over time, memory leaks degrade performance. Restarting the process temporarily fixes it, but the root cause remains.
Insufficient caching. If every request hits the database or recomputes the same values, response time suffers.
Disk I/O bottlenecks. Reading files from slow disks adds latency. Solid-state drives and in-memory caching reduce this.
Blocking operations. Synchronous code that waits for slow operations blocks other requests. Async patterns fix this.
How to Improve Server Response Time
Improving server response time is a process. Start by measuring, then target the biggest bottleneck, then verify the change.
Add database indexes. The single highest-impact fix for many applications. Identify slow queries and add indexes on the columns they filter or join on.
Fix N+1 queries. If your code fetches a list, then loops through it to fetch related records one at a time, you have an N+1 problem. Use batch queries or joins.
Cache aggressively. Cache database queries, computed values, and API responses. Use Redis, Memcached, or in-memory caches. Set appropriate TTLs and invalidation rules.
Use asynchronous processing. For long-running tasks, return a job ID immediately and process in the background. Let the client poll for status.
Paginate large results. Never return thousands of records in a single response. Return pages of 20 to 100 items.
Compress responses. Gzip or Brotli compression reduces payload size by 60% to 80% for text-based responses.
Optimize serialization. Use efficient serializers. For large objects, consider streaming JSON instead of building the entire structure in memory.
Set timeouts on external calls. Without a timeout, a slow dependency can hang your entire response.
Profile your code. Use a profiler to find slow functions. Optimize the ones that consume the most time.
Scale horizontally. Add more server instances to handle increased load. Use load balancing to distribute requests.
Upgrade hardware. Faster CPUs, more memory, and solid-state drives all reduce processing time.
Monitor continuously. Set alerts for server response time thresholds and investigate spikes.
Server Response Time and SEO
Server response time affects search rankings through Core Web Vitals. Specifically, it influences Time to First Byte (TTFB), which is one of the metrics Google uses to evaluate page experience.
Google has stated that TTFB should be under 200ms for optimal performance. Sites with slower server response times may rank lower, especially on mobile where network conditions are more variable.
The relationship is not direct. Google uses many signals, and server response time is one of them. But a slow server response time drags down every page on your site. It also affects other Core Web Vitals like Largest Contentful Paint (LCP), since the browser cannot render content until it receives the first byte.
Improving server response time is one of the highest-leverage SEO investments you can make. It helps every page, every user, and every device.
Server Response Time vs TTFB
These two metrics are closely related but not identical. Understanding the difference helps you diagnose problems accurately.
Server response time measures only what happens on the server. It starts when the request arrives and stops when the first byte leaves. It excludes network travel.
Time to First Byte (TTFB) measures from the client’s perspective. It starts when the browser sends the request and stops when the first byte arrives. It includes DNS resolution, TCP handshake, TLS handshake, network travel, and server response time.
TTFB = Network latency + Server response time
If TTFB is high but server response time is low, the problem is in the network. If TTFB is high and server response time is also high, the problem is on the server.
Browser developer tools show TTFB in the Network tab as “Waiting (TTFB).” To estimate server response time, subtract the network round-trip time from TTFB.
Common Mistakes When Working With Server Response Time
Measuring TTFB and calling it server response time. They are different. TTFB includes network latency.
Ignoring percentiles. Averages hide outliers. Track p50, p95, and p99.
Optimizing without measuring. Do not guess where the bottleneck is. Profile first.
Testing only with small datasets. Queries that are fast with 1,000 rows may be slow with 1 million. Test with realistic data volumes.
Forgetting about cold starts. Serverless functions behave differently on first invocation. Account for this in your benchmarks.
Neglecting external dependencies. Your server is only as fast as its slowest dependency. Monitor third-party services.
Setting unrealistic targets. Aiming for 10ms on a complex query is not always possible. Set targets based on use case.
Not accounting for peak load. Server response time under light load is not the same as under heavy load. Test at expected peak.
Overlooking caching. Many teams optimize code before adding caching. Caching often delivers bigger wins with less effort.
Copy-Ready Template: Server Response Time Report
Use this template to document and share server response time metrics consistently.
text
Report period: [Date range]
Context: [Web app / API / Database]

Server response time metrics:
- Average: [ms]
- p50: [ms]
- p95: [ms]
- p99: [ms]

Breakdown by endpoint:
- Endpoint 1: [Average / p95]
- Endpoint 2: [Average / p95]

Time breakdown (for slowest endpoint):
- Application code: [ms]
- Database queries: [ms]
- External calls: [ms]
- Serialization: [ms]

Bottleneck: [Code / Database / External / Serialization]
Notes: [Any relevant context, such as deploys or traffic spikes]
Server Response Time: Frequently Asked Questions
What is a good server response time?
Under 200ms is good for most web applications. Under 100ms is excellent. Google recommends keeping TTFB under 200ms, and server response time should be well under that to leave room for network latency.
How do I measure server response time?
Use APM tools for code-level detail. and Use browser developer tools to see TTFB, then subtract network round-trip time to estimate server response time. use server logs for per-request timing.
What is the difference between server response time and TTFB?
Server response time measures only the server’s processing time. TTFB measures from the client’s perspective and includes network latency. TTFB equals server response time plus network latency.
Why is my server response time slow?
Common causes include unoptimized database queries, N+1 query patterns, external API calls, inefficient code, large payloads, cold starts, and resource contention. Measure first to find the actual bottleneck.
How can I reduce server response time quickly?
Add database indexes, fix N+1 queries, enable caching, compress responses, and paginate large results. These changes often produce the biggest improvements with the least effort.
Does server response time affect SEO?
Yes, indirectly. Server response time affects TTFB, which is part of Core Web Vitals. Google recommends TTFB under 200ms. Slow server response times can hurt search rankings and user experience.
What is the difference between server response time and latency?
Latency is the time for data to travel between two points. Server response time is the time the server spends processing a request. Latency is a network metric. Server response time is an application metric.
How do I test server response time under load?
Use load testing tools like k6, JMeter, or Locust. These simulate concurrent users and measure how server response time changes as traffic increases. Test at expected peak load to find bottlenecks before they affect real users.
Conclusion
Server response time is the metric that measures how long your server takes to think. It excludes network latency and client rendering. It is the piece of performance that application teams control directly. Measure it consistently, break it down by component, and target the biggest bottleneck first. A fast server response time improves user experience, search rankings, and conversion rates. When you optimize it, every page on your site benefits.
Read More Related Articles :
- 350+ Cold Emails That Get Responses | Proven Templates, Tips & Examples In 2026
- 350+ How to Calculate Response Rate | Formula, Examples & Easy Guide In 2026
- 350+ Cold Email Response Rate | Benchmarks, Averages & Ways to Improve In 2026

James Wilson is a passionate blogger and writer at RespondLabs.com, sharing fresh perspectives on technology, business and everyday digital trends. His writing combines clear insights with an engaging, reader-friendly style.